Table of contents
Thank you
As another year comes to a close, thank you to everyone who used Daily in 2025. Your support and feedback continue to shape Daily.
The 2025 in Review highlights how time was spent throughout the year. These reflections are intended to help you work more intentionally and productively in 2026.
2025 in Review
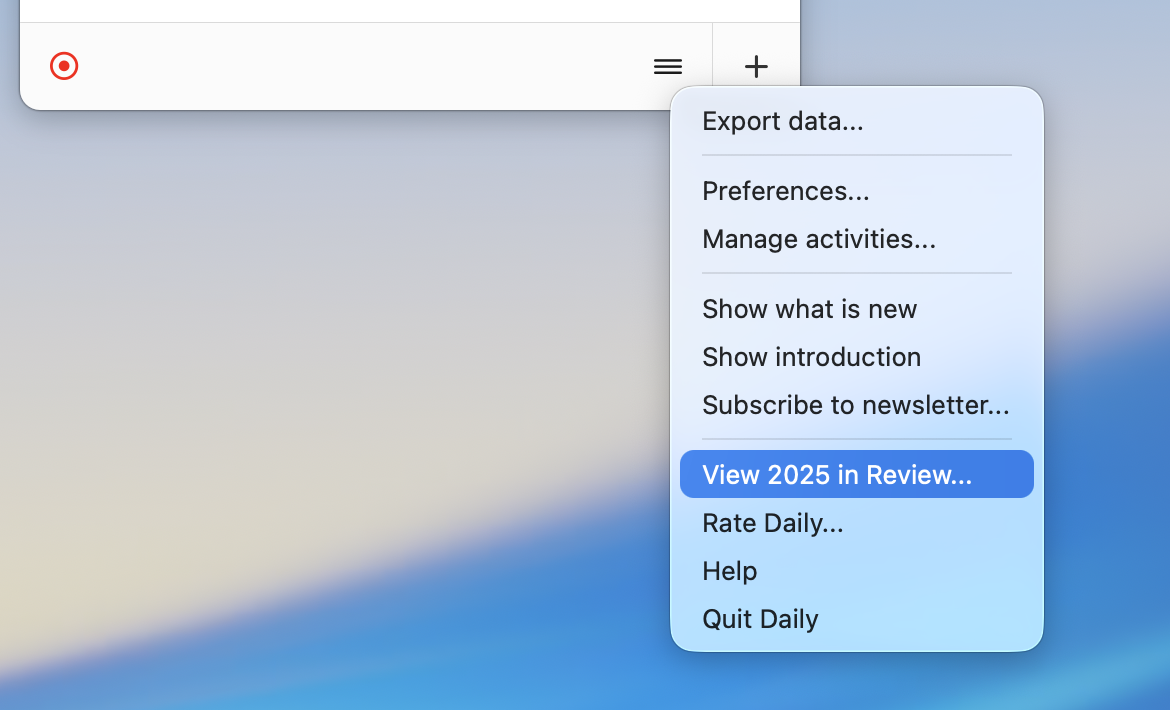
The 2025 in Review is shown in Daily when you’ve recorded at least 24 tracked hours during the year. In the latest version of Daily, it automatically suggests the 2025 in Review when you open your dashboard. You can dismiss the suggestion with the red cross and still find the review in Daily’s menu. It remains accessible until January 11th. The insights provided are based on all activities recorded in 2025, including archived and manually added activities.

Overview
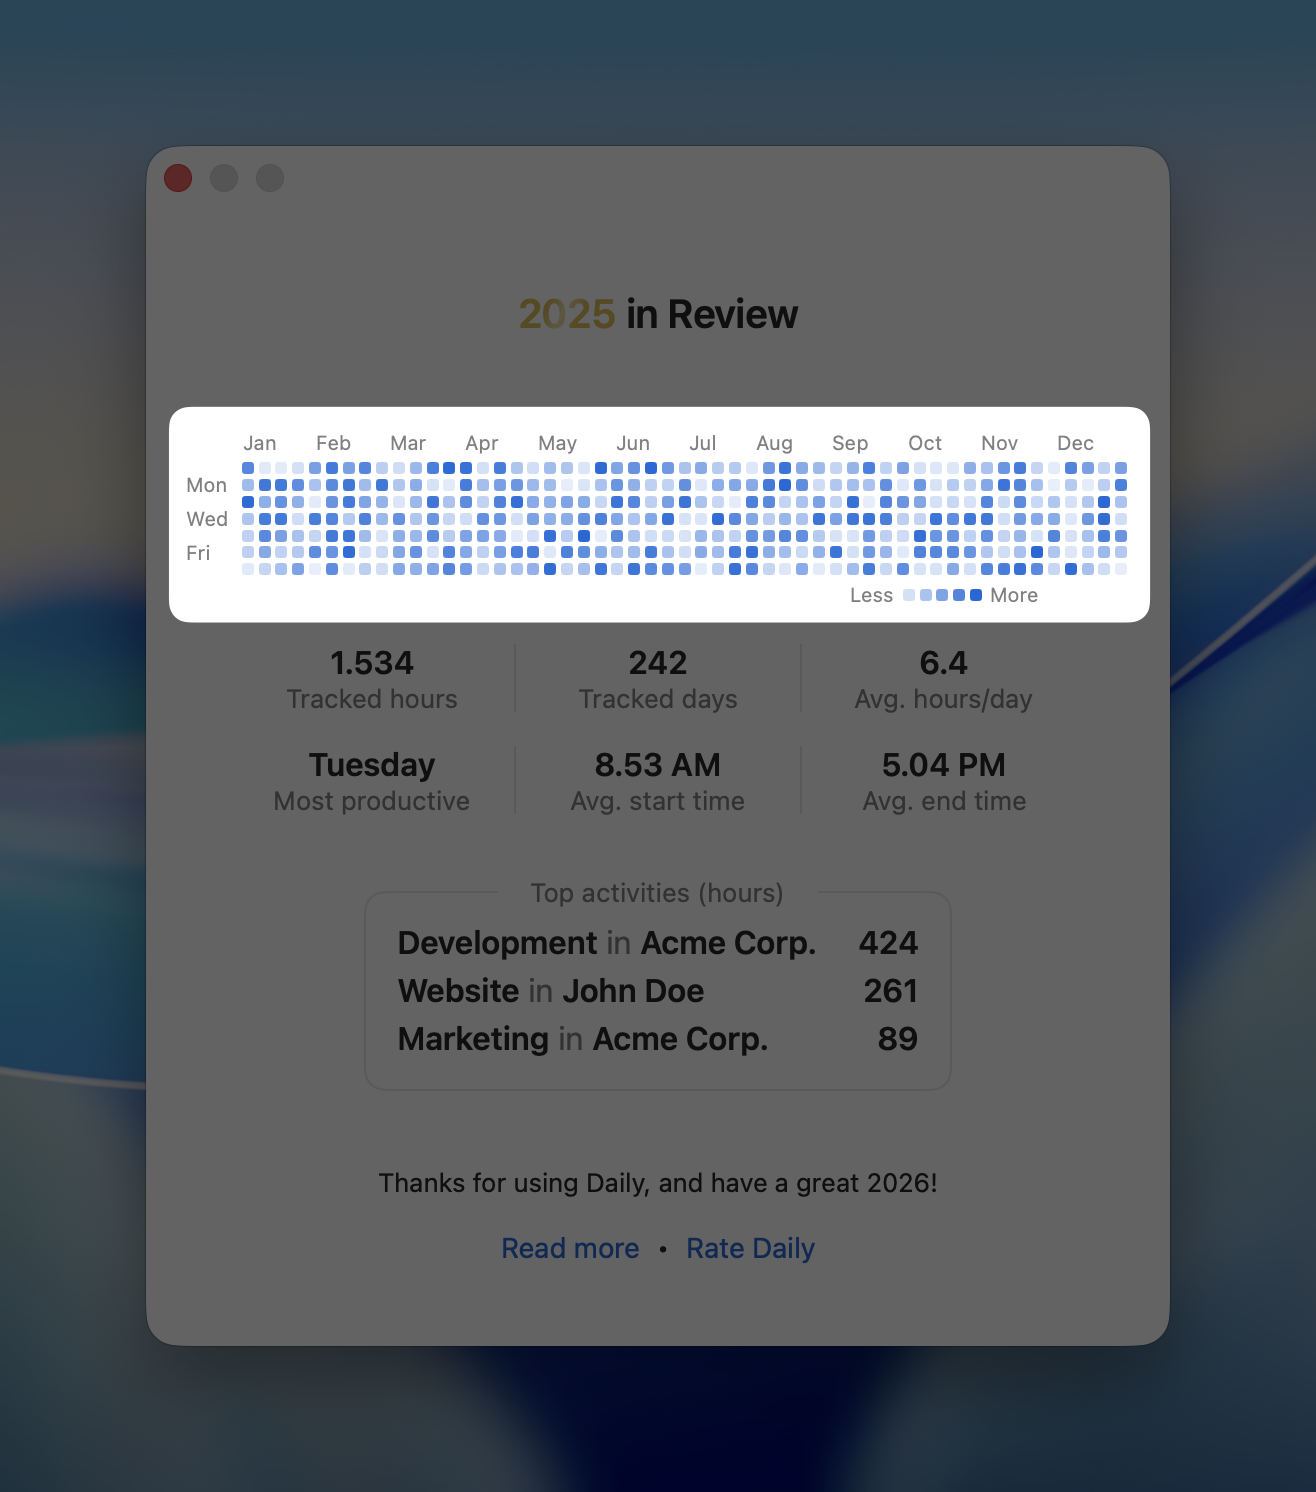
Each square in the grid represents a day in 2025, with color intensity indicating how much time was tracked on that day. This visual helps you spot trends, productive streaks, and quieter periods over the full calendar year. You can click any square to see the total time recorded on that specific day.

Statistics
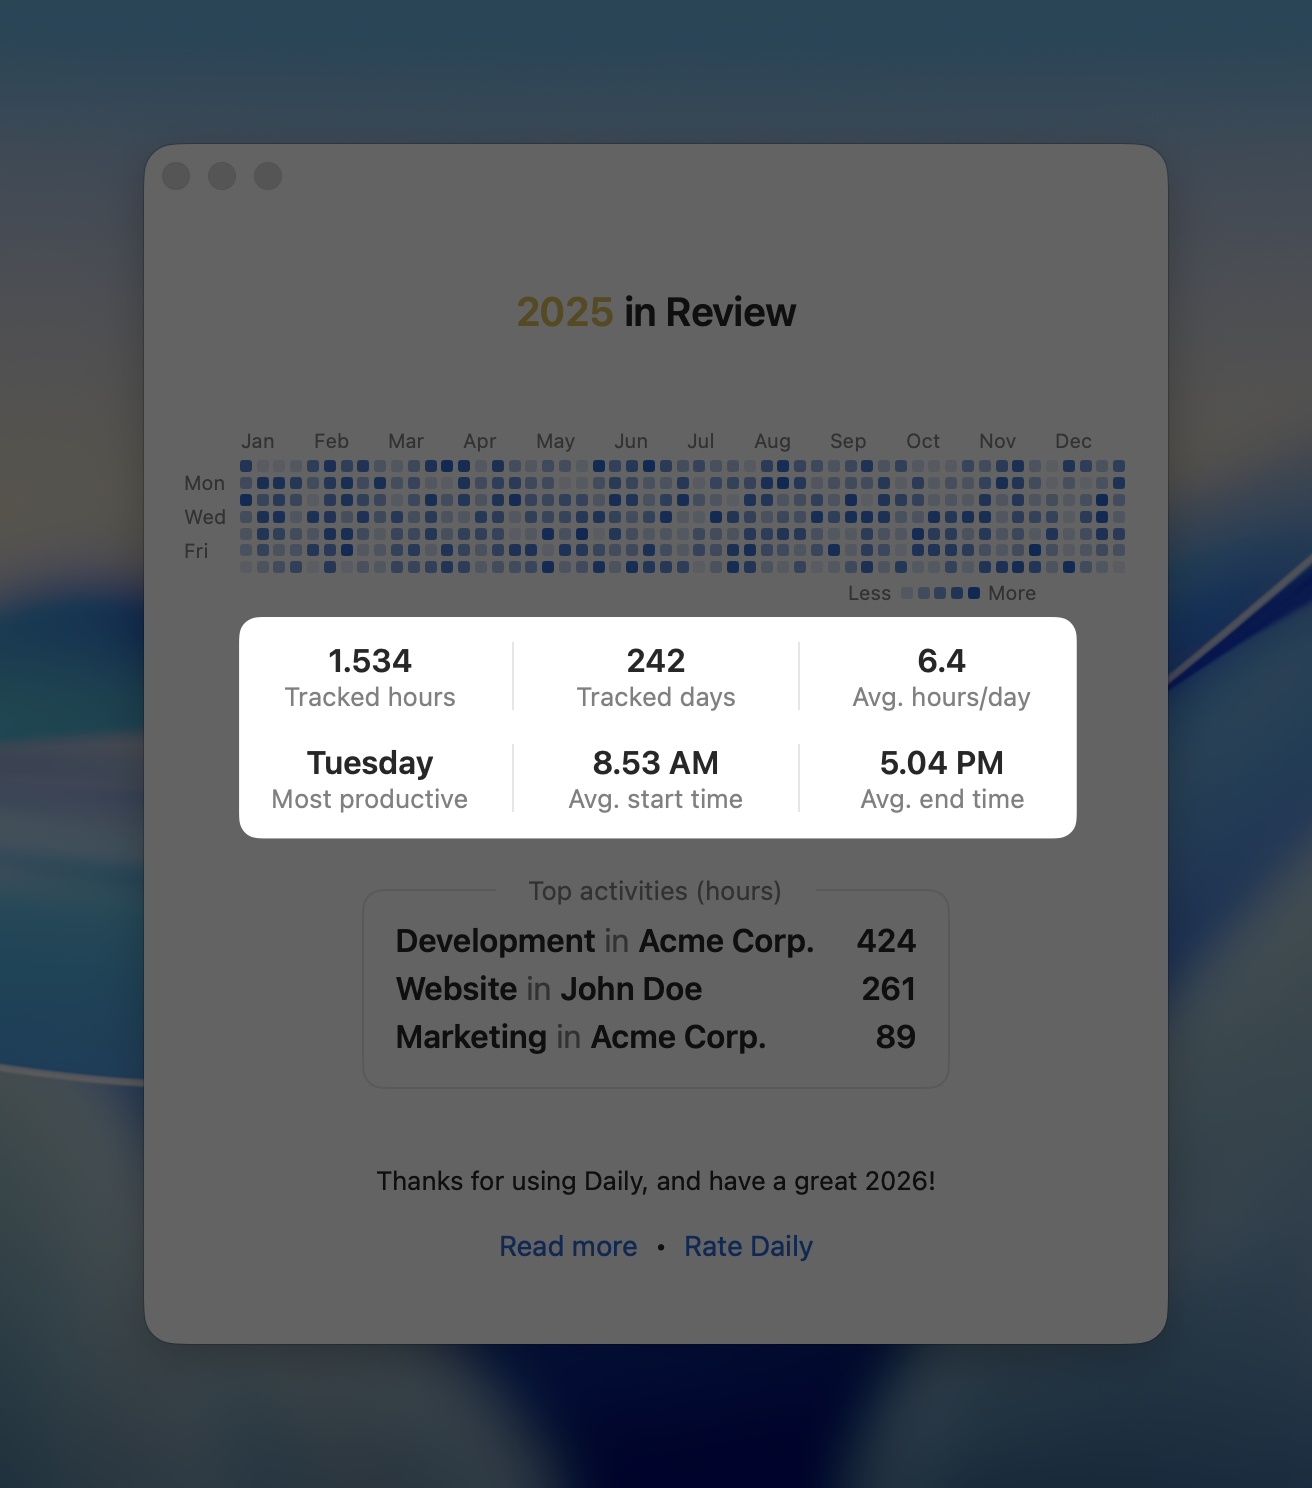
The following statistics are displayed:
Tracked hours: The total hours tracked.
Tracked days: The number of days with tracked data.
Average hours per day: The total hours divided by the number of days with tracked data.
Most productive: The most productive weekday based on the hours tracked.
Average start time: The average start time. Daily automatically records the start time based on when it starts tracking time. There are multiple ways of controlling this. It does not consider outliers, such as quickly managing emails at 9 PM on a Sunday evening.
Average end time: The average end time.

Top activities
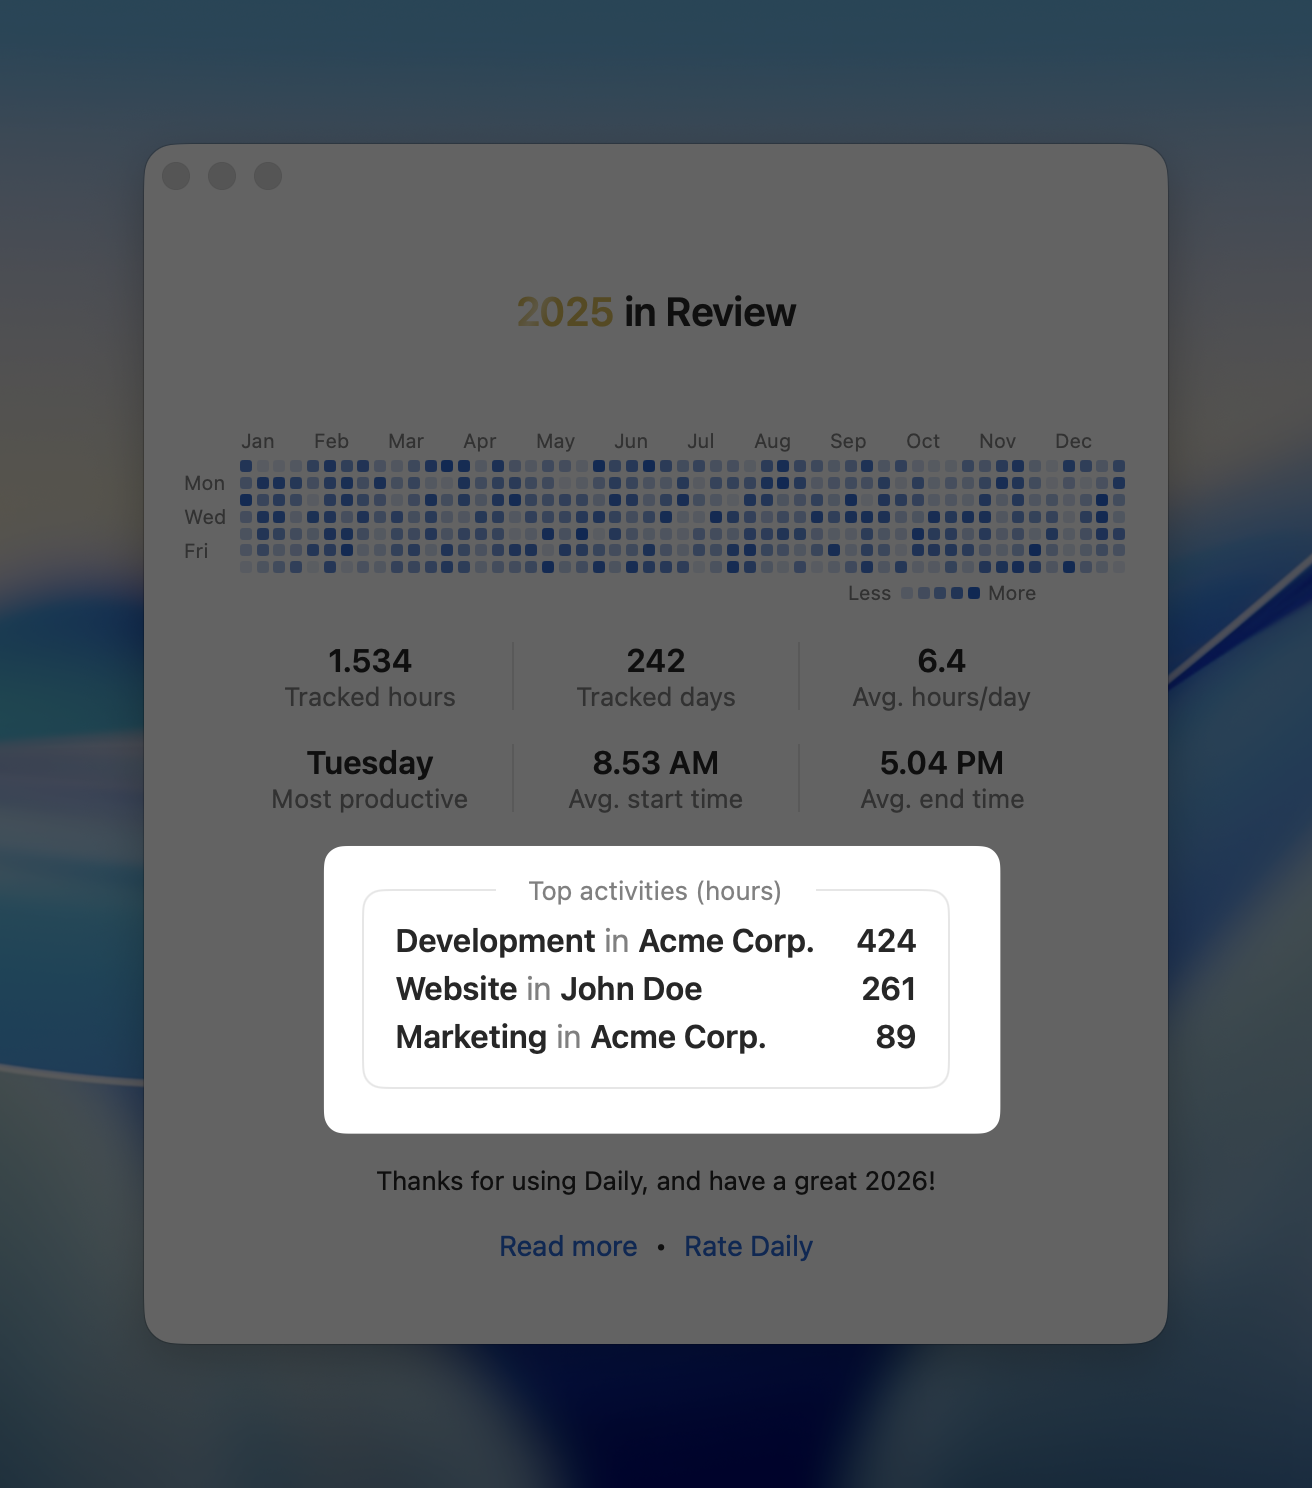
The 3 activities (and their optional groups) you've spent the most time on are displayed, including the number of hours.

The insights in the 2025 in Review are intended to support reflection and planning. Feedback or questions about the review or Daily in general are always welcome.
Wishing you a successful and fulfilling new year!